Chapter 20
Getting the Hint from Epidemiologic Inference
IN THIS CHAPTER
 Choosing potential confounders for your regression model
Using a modeling approach to develop a final model
Adding interactions to the final model
Interpreting the final model for causal inference
In Parts 5 and 6, we describe different types of regression, such as ordinary least-squares regression, logistic regression, Poisson regression, and survival regression. In each kind of regression we cover, we describe a situation in which you are performing multivariable or multivariate regression, which means you are making a regression model with more than one independent variable. Those chapters describe the mechanics of fitting these multivariable models, but they don’t provide much guidance on which independent variables to choose to try to put in the multivariable model.
The chapters in Parts 5 and 6 also discuss model-fitting, which means the act of trying to refine your regression model so that it optimally fits your data. When you have a lot of candidate independent variables (or candidate covariates), part of model-fitting has to do with deciding which of these variables actually fit in the model and should stay in, and which ones don’t fit and should be kicked out. Part of what guides this decision-making process are the mechanics of modeling and model-fitting. The other main part of what guides these decisions is the hypothesis you are trying to answer with your model, which is the focus of this chapter.
In this chapter, we revisit the concept of confounding from Chapter 7 and explain how to choose candidate covariates for your regression model. We also discuss modeling approaches and explain how to add interaction terms to your final model.
Staying Clearheaded about Confounding
Chapter 7 discusses study design and terminology in epidemiology. As a reminder, in epidemiology, exposure refers to a factor you hypothesize to cause a disease (or outcome). In your regression model, the outcome is the dependent variable. The exposure will be one of the covariates in your model. But what other covariates belong in the model? How do you decide on a collection of candidate-independent variables that you would even consider putting in a model with the exposure? The answer is that you choose them on the basis of their status as a potential confounder.
 A confounder is a factor that meets these three criteria:
- It is associated with the exposure.
- It is associated with the outcome.
- It is not on the causal pathway between the exposure and outcome.
As an example, look at Figure 20-1, which illustrates a study of patients with Type II diabetes where there is a hypothesized causal relationship between the exposure of having served in the military and the negative outcome of having an amputation due to diabetic complications.
As shown Figure 20-1, inability to exercise and low income are both seen as potential confounders. That is because they are associated with both the exposure of military service and the outcome of amputation, and they are not on the causal pathway between military service and amputation. In other words, what is causing the outcome of amputation is not also causing the patient’s inability to exercise, nor is it also causing the patient to have low income. But whatever is causing the patient’s amputation is also causing the patient’s retinopathy. That’s because Type II diabetes causes poor circulation, which causes both retinopathy and amputation. This means that retinopathy and amputation are on the same causal pathway, and retinopathy cannot be considered a potential confounder.
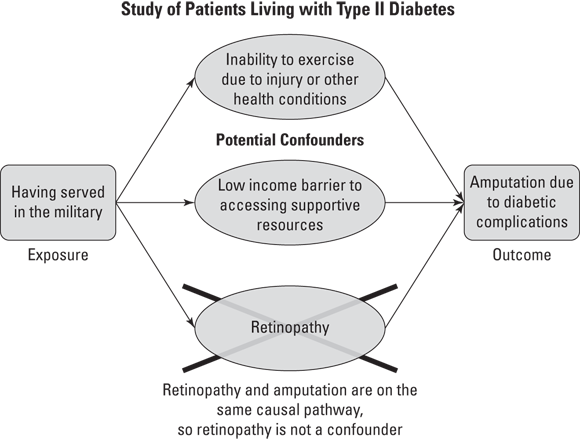
© John Wiley & Sons, Inc.
FIGURE 20-1: Example of how confounders are associated with exposure and outcome but are not on the causal pathway between exposure and outcome.
Avoiding overloading
You may think that choosing what covariates belong in a regression model is easy. You just put all the confounders and the exposure in as covariates and you’re done, right? Well, unfortunately, it’s not that simple. Each time you add a covariate to a regression model, you increase the amount of error in the model by some amount — no matter what covariate you choose to add. Although there is no official maximum to the number of covariates in a model, it is possible to add so many covariates that the software cannot compute the model, causing an error. In a logistic regression model as discussed in Chapter 18, each time you add a covariate, you increase the overall likelihood of the model. In Chapter 17, which focuses on ordinary least-squares regression, adding a covariate increases your sum of squares.
What this means is that you don’t want to add covariates to your model that just increase error and don’t help with the overall goal of model fit. A good strategy is to try to find the best collection of covariates that together deal with as much error as possible. For example, think of it like roommates who share apartment-cleaning duties. It’s best if they split up the apartment and each clean different parts of it, rather than insisting on cleaning up the same rooms, which would be a waste of time. The term parsimony refers to trying to include the fewest covariates in your regression model that explain the most variation in the dependent variable. The modeling approaches discussed in the next section explain ways to develop such parsimonious models.
Adjusting for confounders
When designing a regression analysis, you first have to decide: Are you doing an exploratory analysis, or are you doing a hypothesis-driven analysis? If you are doing an exploratory analysis, you do not have a pre-supposed hypothesis. Instead, your aim is to answer the research question, “What group of covariates do I need to include as independent variables in my regression to predict the outcome and get the best model fit?” In this case, you need to select a set of candidate covariates and then come up with modeling rules to decide which groups of covariates produce the best-fitting model. In each chapter on regression in this book, we provide methods of comparing models using model-fit statistics. You would use those to choose your final model for your exploratory analysis. Exploratory analyses are considered descriptive studies, and are weak study designs (see Chapter 7).
But if you collected your data based on a hypothesis, you are doing a hypothesis-driven analysis. Epidemiologic studies require hypothesis-driven analyses, where you have already selected your exposure and outcome, and now you have to fit a regression model predicting the outcome, but including your exposure and confounders as covariates. You know you need to include the exposure and the outcome in every model you run. However, you may not know how to decide on which confounders stay in the model.
Regardless of whether you are doing exploratory or hypothesis-driven modeling, you need to make rules before you start modeling that describe how you will make decisions about your final model and during your modeling process. You may make a rule that all the covariates in your final model must be associated with a p value that is statistically significant at α = 0.05. You can make other stipulations about the final model, or the process of achieving the final model. What is important is that you make the modeling rules and write them down before you start modeling.
You then need to choose a modeling approach, which is the approach you will use to determine which candidate confounders stay in the model with the exposure and which ones are removed. There are three common approaches in regression modeling (although analysts have their customized approaches). These approaches don’t have official names, but we will use terms that are commonly used. They are: forward stepwise, backward elimination, and stepwise selection.
- Forward stepwise: This is where one confounder covariate at a time is added to the model in iterative models. If it does not meet rules to be kept in the model, it is removed and never considered again in the model. Imagine you were fitting a regression model with one exposure covariate and eight candidate confounders. Suppose that you add the first covariate with the exposure and it meets modeling rules, so you keep it. But when you add the second covariate, it does not meet the rules, so you leave it out. You keep doing this until you run out of variables. Although forward stepwise can work if you have very few variables, most analysts do not use this approach because it has been shown to be sensitive to the order you choose in which to enter variables.
- Backward elimination: In this approach, the first model you run contains all your potential covariates, including all the confounders and the exposure. Using modeling rules, each time you run the model, you remove or eliminate the confounder contributing the least to the model. You decide which one that is based on modeling rules you set (such as which confounder has the largest p value). Theoretically, after you pare away the confounders that do not meet the rules, you will have a final model. In practice, this process can run into problems if you have collinear covariates (see Chapters 17 and 18 for a discussions of collinearity). Your first model — filled with all your potential covariates — may error out for this reason, and not converge. Also, it is not clear whether once you eliminate a covariate you should try it again in the model. This approach often sounds better on paper than it works in practice.
- Stepwise selection: This approach combines the best of forward stepwise and backward elimination. Starting with the same set of candidate covariates, you choose which covariate to introduce first into a model with the exposure. If this covariate meets modeling rules, it is kept, and if not, it is left out. This continues along as if you are doing forward stepwise — but then, there’s a twist. After you are done trying each covariate and you have your forward stepwise model, you go back and try to add back the covariates you left out one by one. Each time one seems to fit back in, you keep it and consider it part of the working model. It is during this phase that collinearity between covariates can become very apparent. After you try back the covariates you originally left out and are satisfied that you were able to add back the ones that fit the modeling rules, you can declare that you have arrived at the final model.
Once you produce your final model, check the p value for the covariate or covariates representing your exposure. If they are not statistically significant, it means that your hypothesis was incorrect, and after controlling for confounding, your exposure was not statistically significantly associated with the outcome. However, if the p value is statistically significant, then you would move on to interpret the results for your exposure covariates from your regression model. After controlling for confounding, your exposure was statistically significantly associated with your outcome. Yay!
 Use a spreadsheet to keep track of each model you run and a summary of the results. Save this in addition to your computer code for running the models. It can help you communicate with others about why certain covariates were retained and not retained in your final model.
 Computer software may include automated processes you can use for fitting models. We discourage you from using these in biostatistics because you want to have a lot of control over how a model is being fitted to make it possible for you to interpret the results. However, these processes can be used to create comparison models — or to simulate improved models — which are perfectly reasonable methods to explore ways to improve your model.
Understanding Interaction (Effect Modification)
In Chapter 17, we touch on the topic of interaction (also known as effect modification). This is where the relationship between an exposure and an outcome is strongly dependent upon the status of another covariate. Imagine that you conducted a study of laborers who had been exposed to asbestos at work, and you found that being exposed to asbestos at work was associated with three times the odds of getting lung cancer compared to not being exposed. In another study, you found that individuals who smoked cigarettes had twice the odds of getting lung cancer compared to those who did not smoke.
Knowing this, what would you predict are the odds of getting lung cancer for asbestos-exposed workers who also smoke cigarettes, compared to workers who aren’t exposed to asbestos and do not smoke cigarettes? Do you think it would be additive — meaning three times for asbestos plus two times for smoking equals five times the odds? Or do you think it would be multiplicative — meaning three times two equals six times the odds?
Although this is just an example, it turns out that in real life, the effect of being exposed to both asbestos and cigarette smoking represents a greater than multiplicative synergistic interaction (meaning much greater than six) in terms of the odds for getting lung cancer. In other words, the risk of getting lung cancer for cigarette smokers is dependent upon their asbestos-exposure status, and the risk of lung cancer for asbestos workers is dependent upon their cigarette-smoking status. Because the factors work together to increase the risk, this is a synergistic interaction (with the opposite being an antagonistic interaction).
How and when do you model an interaction in regression? Typically, you first fit your final model using a multivariate regression approach (see the earlier section “Adjusting for confounders in regression” for more on this). Next, once the final model is fit, you try to interact the exposure covariate or covariates with a confounder that you believe is the other part of the interaction. After that, you look at the p value on the interaction term and decide whether or not to keep the interaction.
Imagine making a model for the study of asbestos workers, cigarette smoking, and lung cancer. The variable asbestos is coded 1 for workers exposed to asbestos and 0 for workers not exposed to asbestos, and the variable smoker is coded 1 for cigarette smokers and 0 for nonsmokers. The final model would already have asbestos and smoker in it, so the interaction model would add the additional covariate asbestos × smoker, which is called the higher order interaction term. For individuals who have a 0 for either asbestos or smoker or both, this term falls out of their individual predicted probability (because 1 × 0 = 0, and 0 × 0 = 0). Therefore, if this term is statistically significant, then individuals who qualify to include this term in their individual predicted probability have a statistically significantly greater risk of the outcome, and the interaction term should be kept in the model.
Getting Casual about Cause
Chapter 7 explains epidemiologic study designs and presents them in a pyramid format. The closer to the top of the pyramid, the better the study design is at providing evidence for causal inference, meaning providing evidence of a causal association between the exposure with the outcome (or in the case of a clinical trial of an intervention, the intervention and the outcome). At the top of the pyramid are systematic review and meta-analysis, where the results of similar studies are combined and interpreted. Because systematic reviews and meta-analyses combine results from other high-quality studies, they are at the very top of the pyramid — meaning they provide the strongest evidence of a causal association between the exposure or intervention and outcome.
An international organization called the Cochrane Collaboration organizes the production of systematic reviews and meta-analyses to help guide clinicians. Their reviews are internationally renowned for being high-quality and are available at www.cochrane.org.
The study designs on the evidence-based pyramid that could be answered with a regression model include clinical trial, cohort study, case-control study, and cross-sectional study. If in your final model your exposure is statistically significantly associated with your outcome, you now have to see how much evidence you have that the exposure caused the outcome. This section provides two methods by which to evaluate the significant exposure and outcome relationship in your regression: Rothman’s causal pie and Bradford Hill’s criteria of causality.
Rothman’s causal pie
Kenneth Rothman described how causes of an outcome are not determinate. In other words, two people can have the same values of covariates and one will get the outcome, and the other will not. We can’t say for sure what values of covariates will mean that you will for sure get the outcome. But that doesn’t mean you can’t make causal inferences. Rothman conceptualized cause as an empty pie tin, and when the pie tin is filled 100 percent with pieces of risk contributed by various causes, then the individual will experience the outcome. The exposure and confounders in your regression model represent these pieces.
For example, cigarette smoking is a very strong cause of lung cancer, as is occupational exposure to asbestos. There are other causes, but for each individual, these other causes would fill up small pieces of the causal pie for lung cancer. Some may have a higher genetic risk factor for cancer. However, if they do not smoke and stay away from asbestos, they will not fill up much of their pie tin, and may have necessary but insufficient cause for lung cancer. However, if they include both asbestos exposure and smoking in their tin, they are risking filling it up and getting the outcome.
Bradford Hill’s criteria of causality
- Sir Bradford Hill was a British epidemiologist who put forth criteria for causality that can be useful to consider when thinking of statistically significant exposure–outcome relationships from final regression models. Although there are more than the criteria we list here, we find the following criteria to be the most useful when evaluating potential exposure–outcome causal relationships in final models:
- First, consider if the data you are analyzing are from a clinical trial or cohort study. If they are, then you will have met the criterion of temporality, which means the exposure or intervention preceded the outcome and is especially strong evidence for causation.
- If the estimate for the exposure in your regression model is large, you can say you have a strong magnitude of association, and this is evidence of causation. This is especially true if your estimate is larger than those of the confounders in the model as well as similar estimates from the scientific literature.
- If your exposure shows a dose-response relationship with the outcome, it is evidence of causation. In other words, if your regression model shows that the more individuals smoke, the higher their risk for lung cancer, this is evidence of causation (see Chapter 18 for more on dose-response relationships).
- If the estimate is consistent in size and direction with other analyses, including previous studies you’ve done and studies in the scientific literature, there is more evidence for causation.